What is Grafana?
“Grafana is a multi-platform open source analytics and interactive visualization web application. It can produce charts, graphs, and alerts for the web when connected to supported data sources.” [2]
It is a monitoring platform used widely for visualizing time-series data. It is known for its flexibility, powerful features, and user-friendly interface. In this article, we will walk through the steps to install Grafana on various platforms and get you started with creating dashboards for your data.
Installation on Linux (Ubuntu/Debian):
You can visist this to check the lastest version or other distributions:
1. Update APT :
sudo apt update2. Install Grafana:
sudo apt-get install -y adduser libfontconfig1 musl
wget https://dl.grafana.com/enterprise/release/grafana-enterprise_10.4.2_amd64.deb
sudo dpkg -i grafana-enterprise_10.4.2_amd64.deb


3. Start and Enable Grafana Service:
sudo systemctl start grafana-server
sudo systemctl enable grafana-server
4. Access Grafana:
Open your web browser and visit `http://localhost:3000`. Log in with the default credentials (admin/admin) and follow the on-screen instructions to change the password.

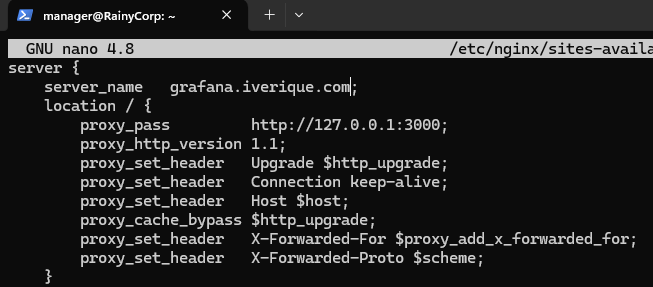
5. Use Reverse Proxy to Serve your Application


You can check articles on Nginx and Apache:
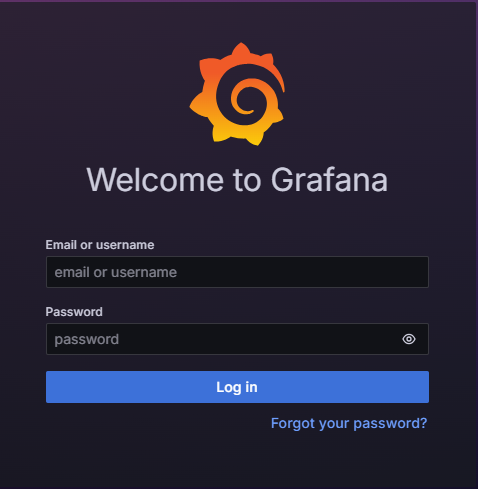
You should see this login page if you go to /login:

An other alternative to this installation is to use a docker container which can be discussed in another article.
Getting Started with Grafana:
0. First Time Login:
You can follow the documentation to sign in to Grafana:
For the first time, you can use admin for username and password.


- Data Sources:
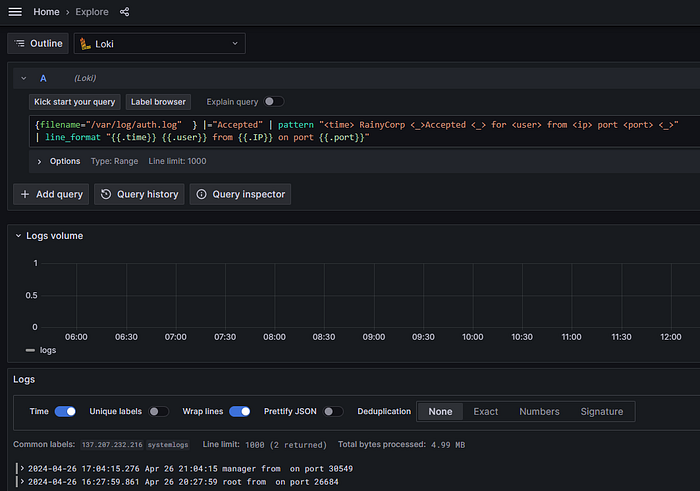
Connect Grafana to your data sources like Prometheus, InfluxDB, MySQL, or others. Go to Configuration > Data Sources to add and configure data sources.

2. Create Dashboards:
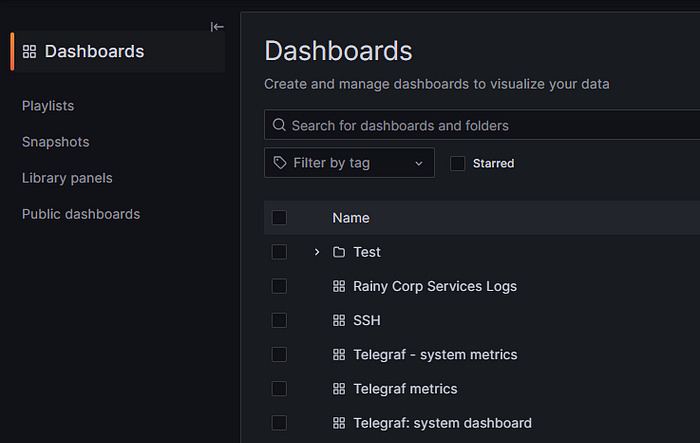
Click on the “+” icon on the left sidebar and select “Dashboard.” Add panels to your dashboard and configure them to display the data you want.


3. Explore Plugins:
Grafana has a rich plugin ecosystem. Explore and install plugins from the Plugin section to extend Grafana’s functionality.

4. Share and Collaborate:
Share your dashboards with colleagues or the public. Grafana provides options to share snapshots, create links, and set permissions for users.
5. Alerting:
Set up alerts based on your data thresholds. Define alert rules and notifications to stay informed about important changes in your metrics.

6. Explore Grafana Labs:
Visit Grafana Labs for tutorials, documentation, and community support. Join forums, attend webinars, and contribute to the Grafana community.
References:
[1] “Dashboards,” Grafana Labs. Available: https://grafana.com/grafana/dashboards/
[2] “Grafana,” Wikipedia, Dec. 31, 2021. Available: https://en.wikipedia.org/wiki/Grafana
[3] “Grafana: The open observability platform,” Grafana Labs, 2020. Available: https://grafana.com
More stories:
